Report: The Story and Mystery of Pokémon — A Comprehensive Data Science Exploration
library(rvest)
library(tidyverse)
library(janitor)
pokemon_df <- read_csv("data/pokemon_data_final_evolutions_enriched.csv")
Motivation
- Dataset: 1,025 Pokémon species across 9 generations (1996-2025)
- Why Pokémon?
- Rich, structured dataset with quantitative and categorical features
- Perfect case study for demonstrating complete data science workflow
- Combines statistical rigor with creative exploration
- Practical application for competitive play and team building
- Motiviation
The Pokémon dataset offers a rich and structured environment for applying data science methods to explore relationships between attributes, performance, and design balance. Each Pokémon is described by a variety of quantitative and categorical features—such as type, stats, generation, and legendary status—making it an excellent case study for classification, clustering, and predictive modeling. Analyzing this dataset allows us to practice fundamental data science workflows, including data cleaning, feature engineering, visualization, and model evaluation, while also addressing interesting questions such as: What characteristics make a Pokémon strong? Are legendary Pokémon statistically distinct from others? By combining statistical reasoning with creative curiosity, this project aims to turn a familiar and entertaining topic into a meaningful data-driven exploration.
Initial Questions
Core Questions:
- Pokémon Base Data Analysis: Is there any pattern in the distribution of Pokémon types and stats?
- Physical Attributes Analysis: Do Pokémon ecosystems or their height-weight distributions have any real-world analogues?
- Type Effectiveness: Which type (or type combination) is the strongest overall? Which is the weakest?
- Legendary Classification: Is it possible to build a classifier to identify legendary Pokémon?
- Rating System Development: Based on Pokémon type and stats, can we provide a Pokémon rating system for beginners?
Extended Questions:
- System Validation: Does the “best” Pokémon team selected through this rating system actually match competitive standards (based on “Pokémon Masters” reviews)?
- Team Building Utility: Can you build a “best” Pokémon team based on this rating system? In other words, is this system reliable or useful as a reference?
Data
| Source | Description | URL |
|---|---|---|
| PokémonDB | Complete Pokémon Stats and Physical Attributes scraped from web | (Complete Pokémon Pokédex)(List of Pokémon by height and weight) |
| BULBAGARDEN | “Fully evolved Pokémon only list” scraped from web | (Fully evolved Pokémon List) |
Pokémon Dataset Overview Full
| Metric | Value |
|---|---|
| Species Count | 1,025 Pokémon |
| Generations | Gen 1–9 (1996–2025) |
| Features | 18 attributes |
Pokémon Dataset Overview Part
Evolved and Final Form of Pokémon Only
| Metric | Value |
|---|---|
| Species Count | 576 Pokémon |
| Generations | Gen 1–9 (1996–2025) |
| Features | 19 attributes |
Key Variables
| Variable | Type | Description |
|---|---|---|
dex |
Integer | National Pokédex number |
name |
String | Official species name |
type_1 / type_2 |
Categorical | Primary and secondary types |
total |
Integer | Base Stat Total (BST) |
hp … speed |
Integer | Individual base stats |
is_legendary |
Boolean | Legendary status flag |
is_special |
Boolean | Legendary status flag |
category |
Factor | Regular / Legendary / Mythical / Paradox / Ultra Beast |
generation |
character | Pokémon Game Generation Number |
is_dual_type |
Boolean | Dual Type Identifier |
Data Cleaning Highlights
- Table Joining: Merged stats, dimensions, and evolution data by Pokédex number
- Type Parsing: Split combined type strings into
type_1andtype_2 - Special Case Handling:
- Pokémon name: Not standard/official (Even cannot
properly fix by using R code).
- All “Pokémon name” renamed using AI-assisted manual processes.
- Eternatus Eternamax: No official height or weight
data exists
- Removed because unusable in normal Pokémon games and cannot be analyzed conventionally.
- Pokémon name: Not standard/official (Even cannot
properly fix by using R code).
- Creating Long table: Using
pivot_longercleaned the type chart into an easy-to-read matrix of damage multipliers for every type matchup.
Exploratory Analysis
EDA
Our exploratory analysis aimed to understand the structure, distribution, and internal relationships of key Pokémon attributes before proceeding to modeling. We focused on visual diagnostics, summary statistics, and transformation-based exploration to uncover patterns that informed later methodological choices.
- Overview of Pokémon Statistics
We began by examining the six base stats (HP, Attack, Defense, Special Attack, Special Defense, Speed) and the total Base Stat Total (BST). The histogram of BST revealed a multi-modal distribution rather than a unimodal or normal structure, suggesting intentional “tiering” in Pokémon design rather than random natural variation. This supported the decision to avoid parametric modeling that assumes normality when analyzing BST directly. The distributions of individual stats displayed varied shapes and ranges—HP and Defense showing heavier right tails, Speed being more evenly spread. These differences highlighted the need to treat stats independently during later PCA and clustering steps rather than relying solely on BST.
- Comparing Extreme and Typical Pokémon
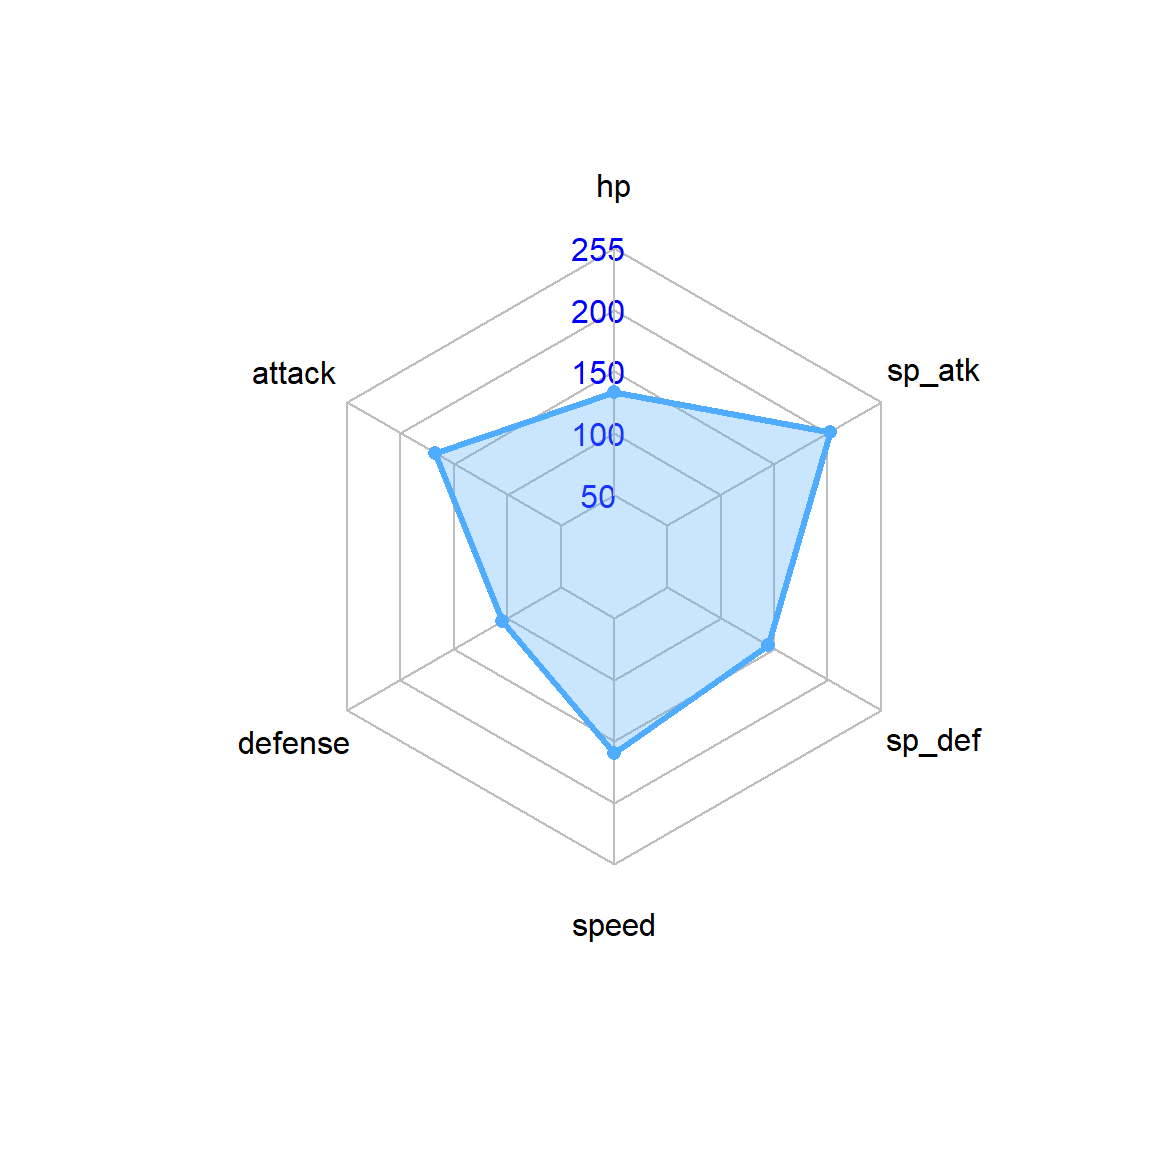
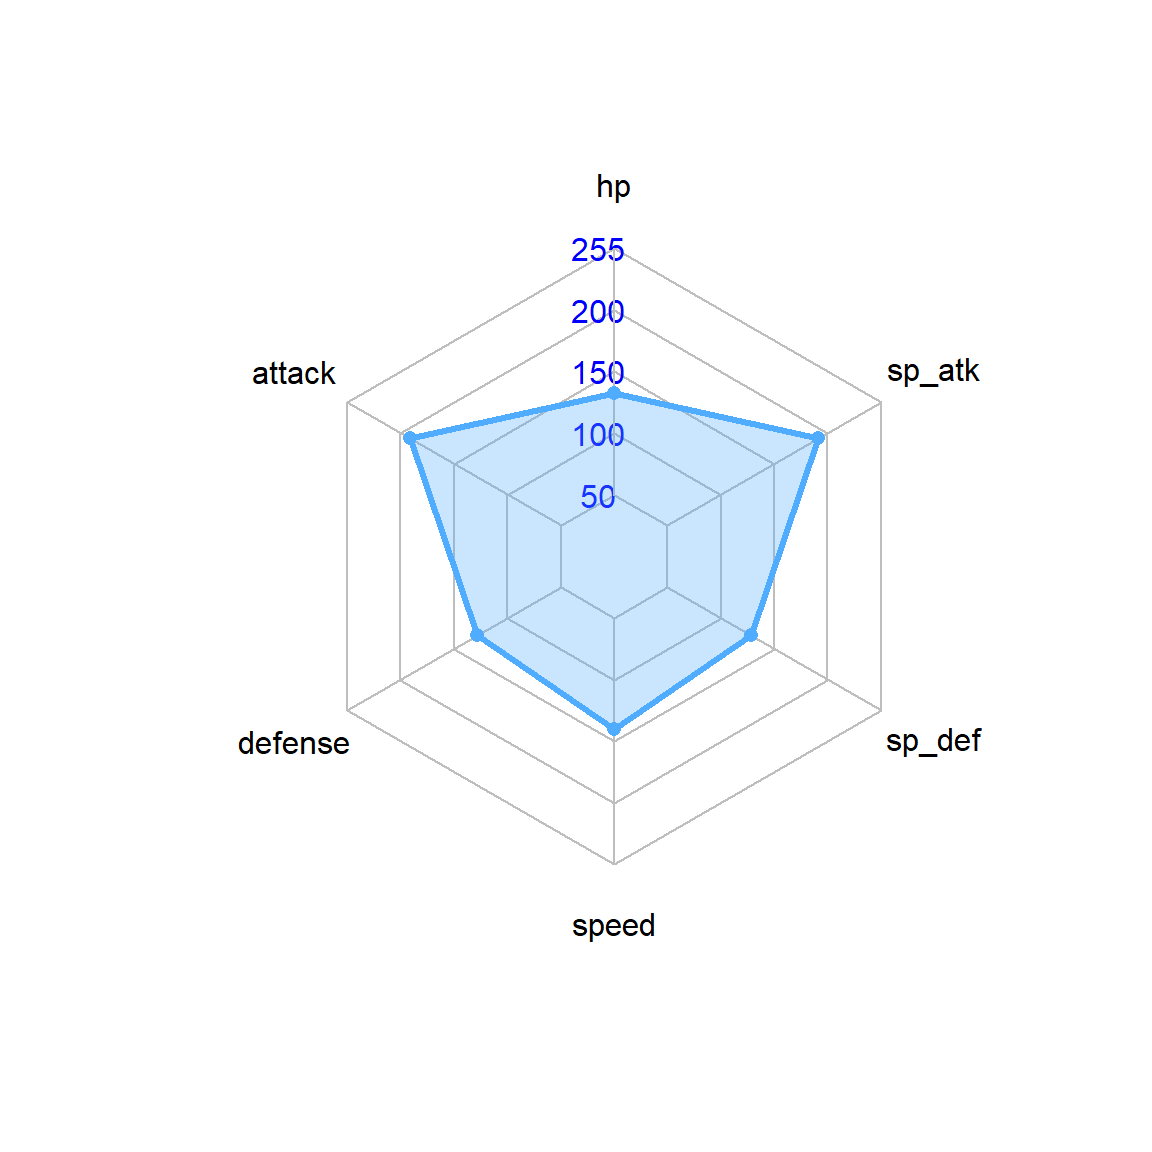
To better understand variation in stat profiles, we created radar plots comparing one of the weakest fully evolved Pokémon (Wishiwashi Solo Form) with one of the strongest (Mega Rayquaza). This qualitative comparison illustrated how extreme Pokémon deviate from population means across all six stats, reinforcing that Pokémon design follows distinctive archetypes. This motivated us to later examine whether PCA would capture these archetypal differences.
- Physical Attributes: Height, Weight, and BMI
Height and weight showed heavily right-skewed distributions, spanning several orders of magnitude. Applying log transformations revealed smooth, interpretable patterns, indicating biological scaling relationships similar to those observed in real animal species. The height–weight scatterplot on a log–log scale suggested a near-linear relationship, consistent with power-law scaling. BMI contained extreme outliers (e.g., Cosmoem), so we applied a data filter to visualize the meaningful distribution. This step was necessary to prevent single outliers from compressing the rest of the data—a decision that also informed later modeling, where we excluded non-representative extreme physical measurements.
- Typing Structure and Prevalence
We explored Pokémon type diversity by counting primary and secondary types. Water, Flying, and Psychic emerged as the most common, while combinations like Normal/Flying dominated dual-type frequencies—a pattern consistent with game design traditions. These findings justified including type as a categorical predictor in later classification models, since type prevalence clearly drives structural differences across populations. Type-based BST boxplots revealed systematic differences: Dragon and Psychic Pokémon possess notably higher average BST, whereas Bug and Normal types tend to be lower. This supported the hypothesis that type encodes meaningful structural information that PCA and downstream supervised learning methods could exploit.
- Special Categories (Legendary, Mythical, Paradox,
etc.)
A key exploratory step involved comparing Legendary vs non-Legendary Pokémon. A Welch’s t-test showed a highly significant difference in mean BST (>100-point gap), with Legendaries displaying much tighter and higher distributions. These differences justified treating category as a grouping variable during modeling and suggested that any predictive model involving BST must carefully consider category imbalance.
- Summary
Our exploratory work revealed several insights that shaped later analysis decisions:
- Pokémon stats are structured, not random, with clear modes and
archetypes.
- Scaling transformations (e.g., log height/weight) are necessary for
meaningful visualization and PCA.
- Type and special categories encode strong statistical signals and
must be included in predictive models.
- Outliers meaningfully influence physical attribute scales and must be filtered or transformed for analysis.
- Pokémon stats are structured, not random, with clear modes and
archetypes.
Additonal Analysis
PCA
To better understand the multivariate structure of Pokémon statistics and reduce dimensionality for downstream modeling, we conducted Principal Component Analysis (PCA) on standardized versions of the six base stats: HP, Attack, Defense, Special Attack, Special Defense, and Speed. Standardization was necessary because these attributes are measured on similar but not identical scales, and unscaled PCA would overweight variables with larger variance.
- Variance Explained and Component Selection
The scree plot showed that the first two principal components (PCs) captured a substantial proportion of total variance, with PC1 explaining the largest share. This justified using PC1 and PC2 for visualization and exploratory clustering. While later components each explained smaller amounts of variance, the first few PCs together captured the primary axes of differentiation across Pokémon.
- Interpreting the Principal Components
Examining the PCA loadings revealed distinct conceptual interpretations of the first two components: PC1 (Overall Power Axis): PC1 loaded positively on nearly all six stats, particularly Attack, Special Attack, and Speed. This suggests that PC1 represents a general strength or combat effectiveness dimension. Pokémon with high PC1 scores tend to be strong attackers or well-rounded fighters, whereas low-PC1 Pokémon tend to be weaker or early-stage forms. (Offense–Defense Tradeoff Axis):displayed contrasting loadings between offensive stats (Attack, Sp. Attack) and defensive stats (Defense, Sp. Defense). Positive PC2 values correspond to defensive-oriented Pokémon, while negative PC2 values correspond to offense-heavy species. This axis reflects a strategic design dichotomy within the Pokémon universe.
- PCA Biplots and Group Structure
The PCA scatterplot showed clear separation of Pokémon categories: Legendary and pseudo-legendary Pokémon cluster toward the upper-right region of the PC1–PC2 space, reflecting both high stats and more balanced distributions. Early-game or unevolved Pokémon cluster near the origin, indicating uniformly low stats. Specialized attackers (e.g., glass cannons) occupy extreme negative PC2 regions, while tanks and walls appear in high-PC2 regions. These patterns confirm that Pokémon occupy structured roles defined by statistical profiles, and that PCA successfully captures these underlying archetypes.
- How PCA Informed Later Decisions
Findings from PCA directly influenced our modeling choices: PCA revealed that the dataset contains continuous gradients, not discrete clusters, causing us to refine our original clustering approach toward soft clustering and dimensionality-informed visualization rather than strict k-means segmentation. The strong separation between Legendary and non-Legendary Pokémon demonstrated that category variables are highly informative, motivating us to include category as a feature in later predictive models. The identification of offense–defense tradeoffs motivated the creation of composite metrics (e.g., offensive index, defensive index) to supplement PCA-derived insights.
- Summary
Overall, PCA validated that Pokémon design is multidimensional and strategically structured, with clear axes representing general power and combat roles. These insights guided both model selection and feature engineering in subsequent stages of analysis.
Rating System
Why a Dual Rating System?Traditional metrics such as BST fail to distinguish between offensive and defensive roles. A Pokémon may have excellent stats but poor defensive typing, or great bulk but no offensive pressure.
To address these limitations, we designed a Dual Rating System consisting of:
- Offensive Rating (0–100)
- Defensive Rating (0–100)
This kind of decomposition tries to approximate real battle
conditions as closely as possible, given that we can’t take each
Pokémon’s movepool into account. Offensive and defensive performance
rely on different stats and completely different type advantages.
By separating them, we can create a rating system that’s easier to
understand and better reflects each Pokémon’s intended role.
(Click here to view the detailed algorithms.)
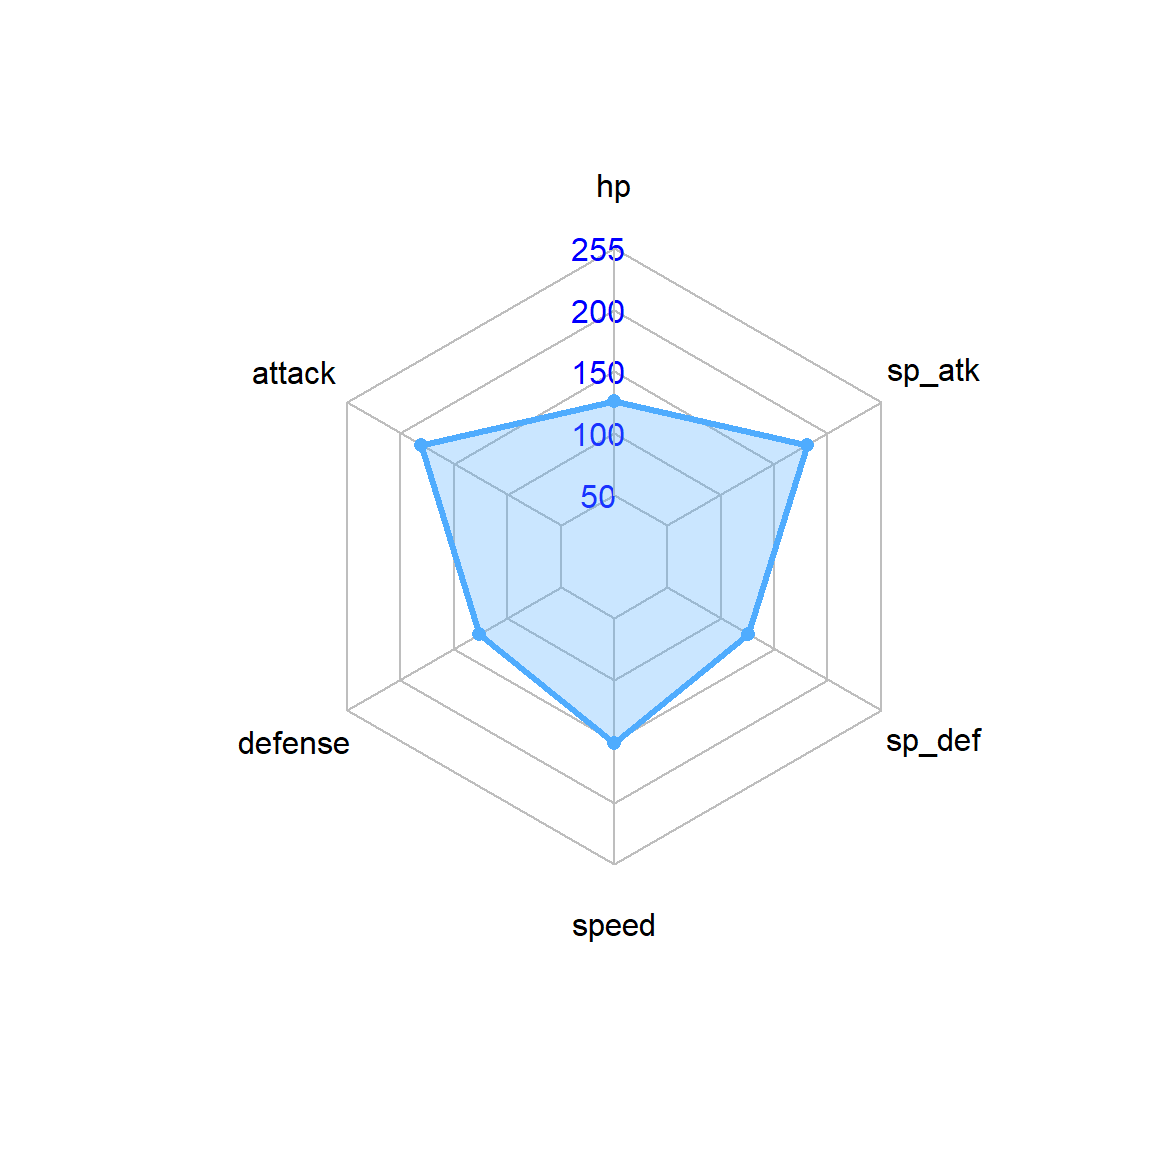
Top 3 Offensive Rated Pokémon:
Mega Mewtwo Y

Mega Rayquaza

Ultra Necrozma

⭐Are they strong?
- Mega Mewtwo Y
- One of the strongest special attackers ever created—huge Speed, massive Special Attack, and vast coverage make it nearly impossible to wall. Extremely fragile, but its offensive pressure is unmatched.
- Mega Rayquaza
- A completely unrestricted powerhouse with overwhelming mixed offenses and access to Dragon Ascent. Hits harder than almost anything and doesn’t even need a Mega Stone, which pushes it far beyond standard balance.
- Ultra Necrozma
- A blisteringly fast, incredibly strong mixed attacker with great coverage. Its boosted stats and Photon Geyser give it explosive burst potential, though it requires setup to transform.
Offensive Pokémon List(Best to worst)
read.csv("data/top_offensive.csv") |>
  mutate(defensive_rating = round(defensive_rating, 2),
         offensive_rating = round(offensive_rating, 2)) |>
  DT::datatable(
    options = list(
      pageLength = 10,
      scrollX = TRUE
    )
  )
Top 3 Defensive Rated Pokémon:
Zygarde Complete Forme

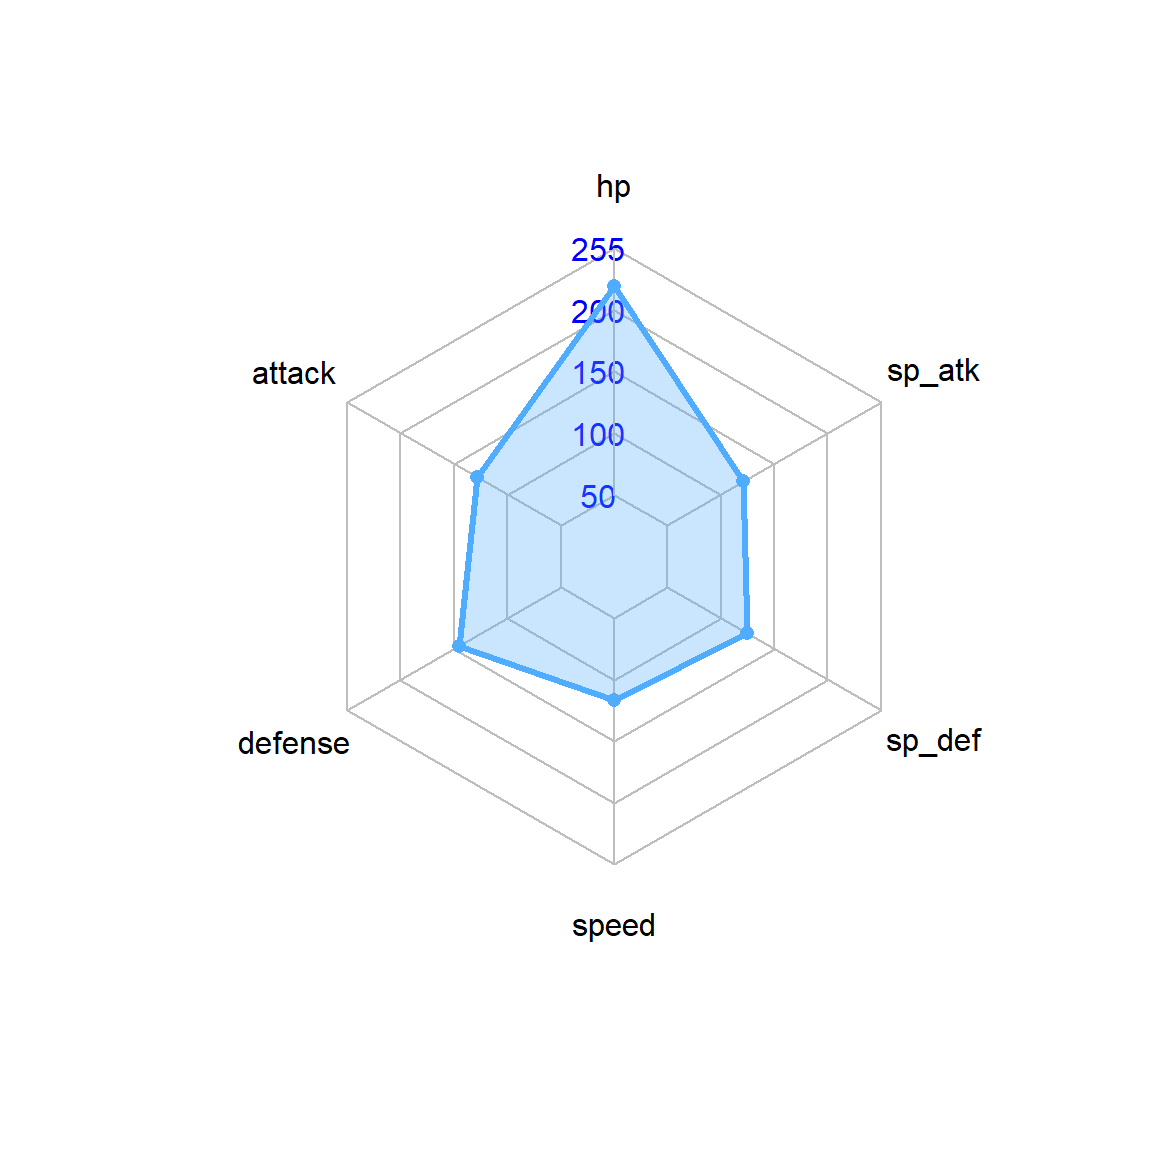
Giratina Altered Forme

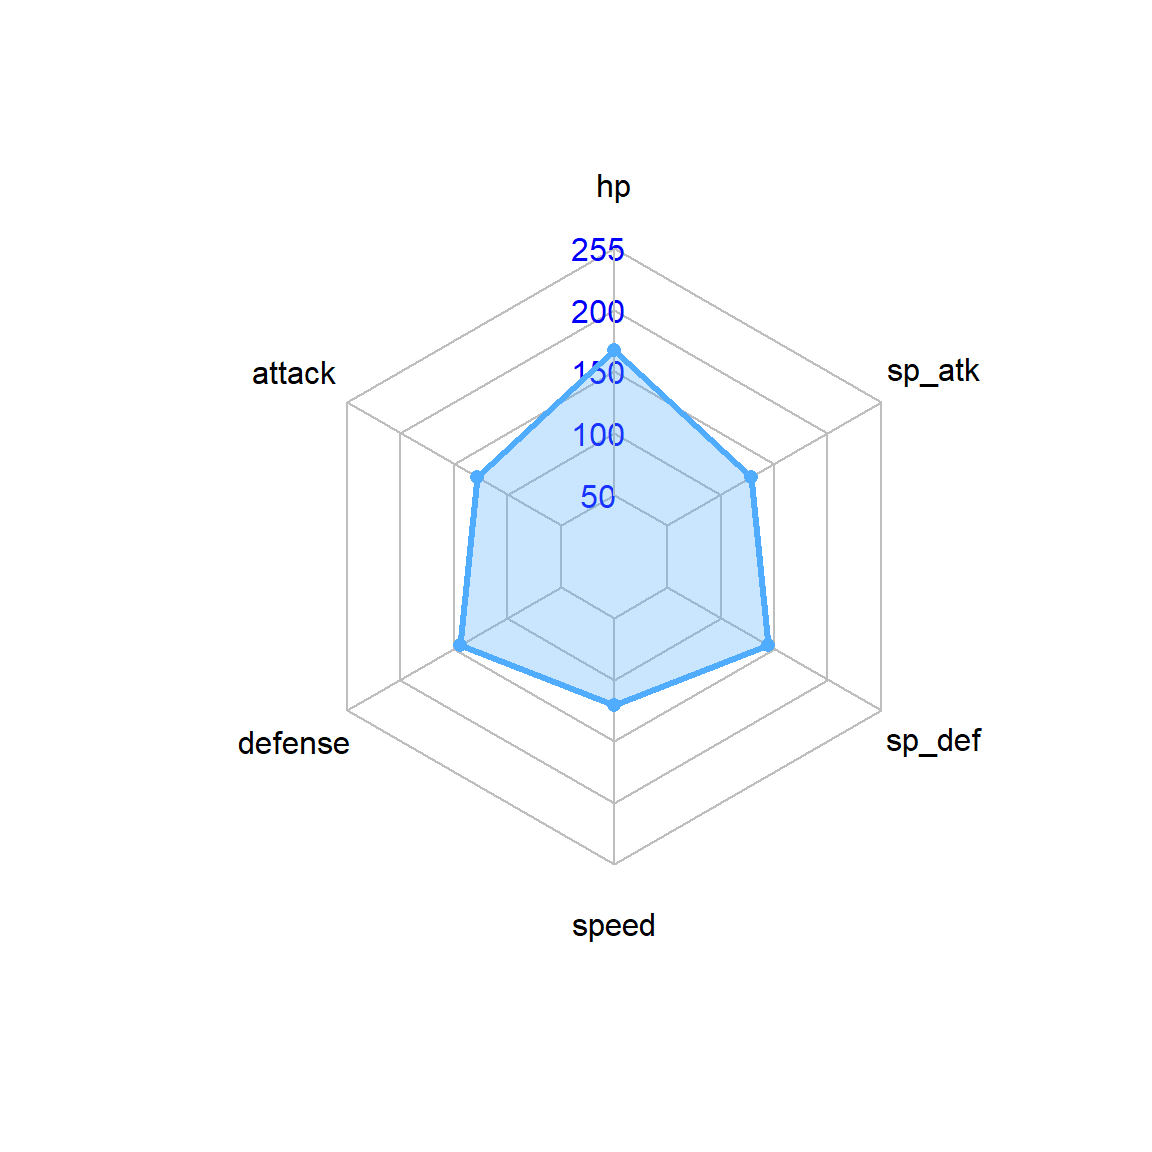
Zacian Crowned Sword

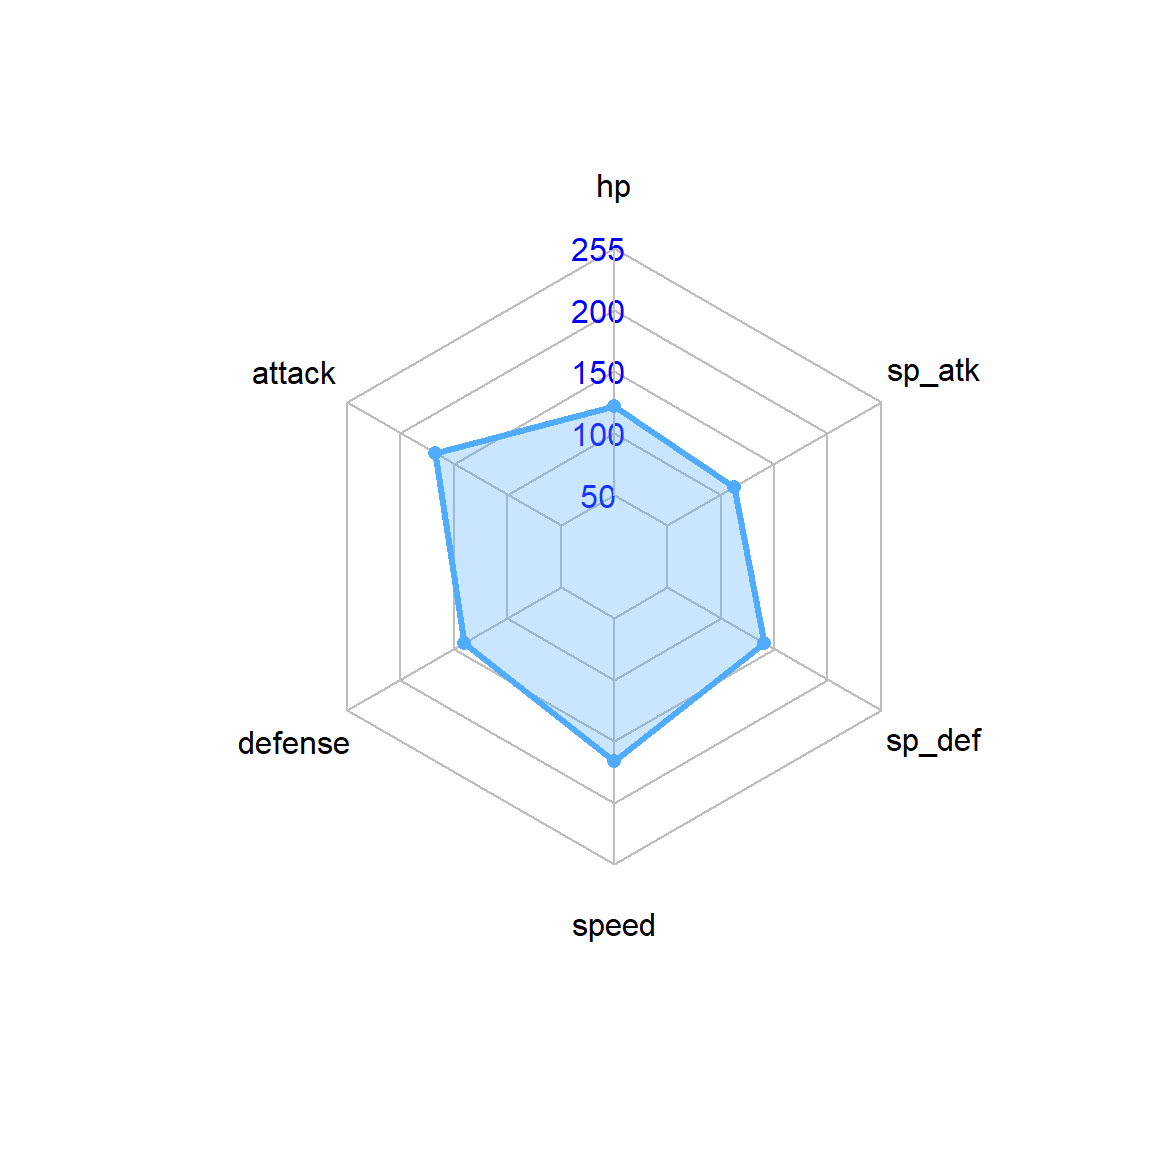
⭐Are they strong?
- Zygarde Complete Forme
- Incredibly bulky with outstanding overall defenses. Its biggest limitation is activating Power Construct, which requires dropping below 50% HP—making its full defensive potential harder to access in real battles.
- Giratina Altered Forme
- One of the most naturally tanky Pokémon in the series, with excellent mixed bulk and strong defensive typing. However, despite its durability, its practical impact in many formats is limited due to low offensive pressure and passive playstyle.
- Zacian Crowned Sword
- Primarily known for overwhelming offense, but its Fairy/Steel typing and high base stats also give it strong defensive resilience. Its bulk isn’t its main role, yet it still out-tanks many offensive Pokémon. One of the most theoretically perfect Pokémon.
Defensive Pokémon List(Best to worst)
read.csv("data/top_defensive.csv") |>
  mutate(defensive_rating = round(defensive_rating, 2),
         offensive_rating = round(offensive_rating, 2)) |>
  DT::datatable(
    options = list(
      pageLength = 10,
      scrollX = TRUE
    )
  )
Best 3 Regular Pokémon:
For Beginners
Considering both strong offense and strong defense.
Mega Alakazam

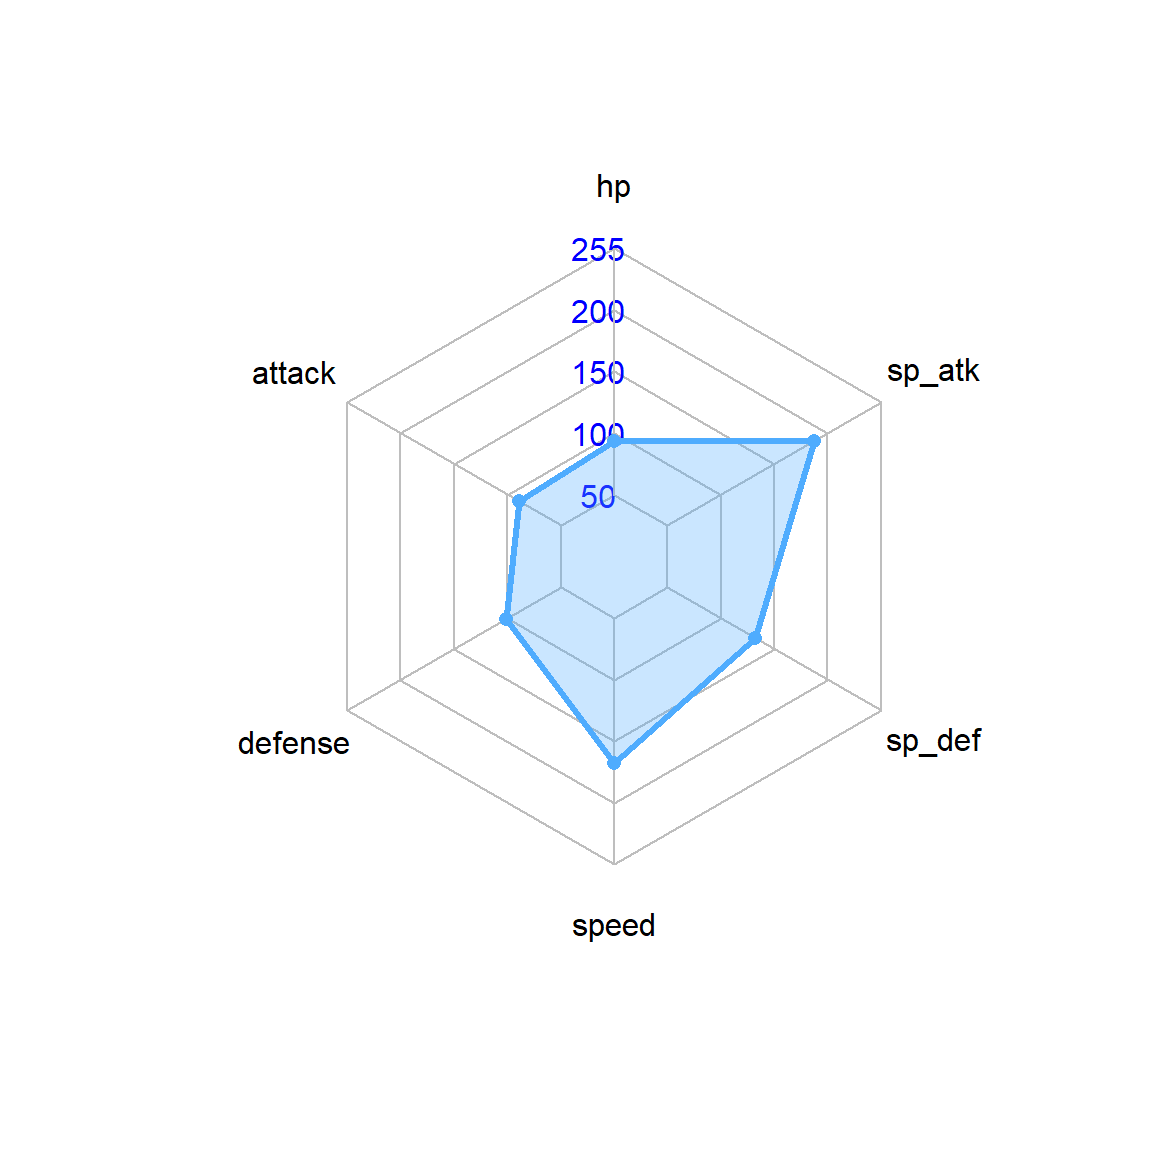
Mega Metagross

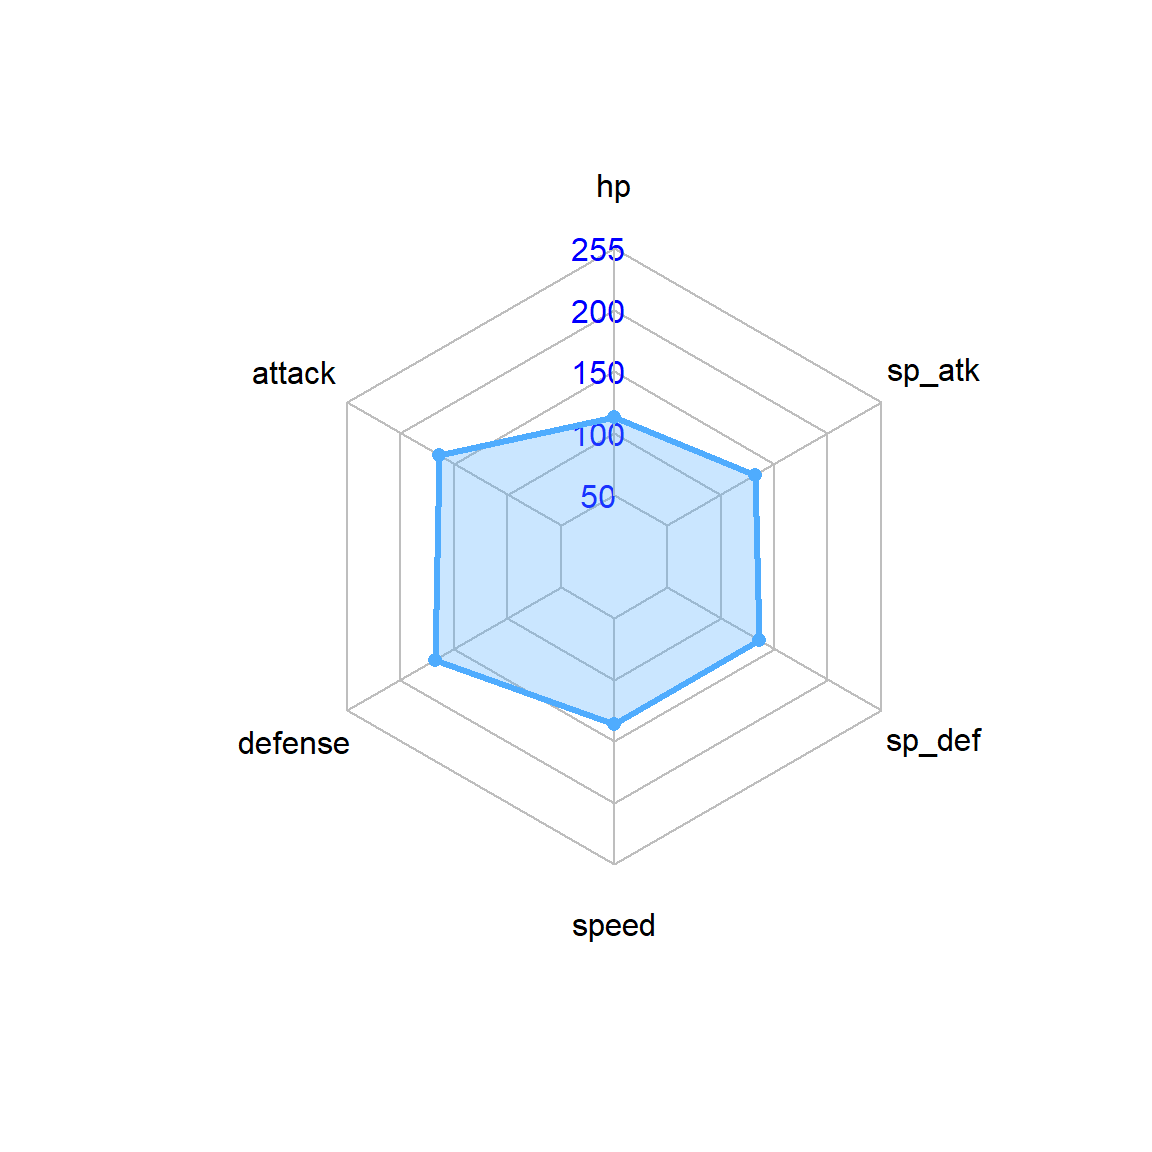
Mega Aggron

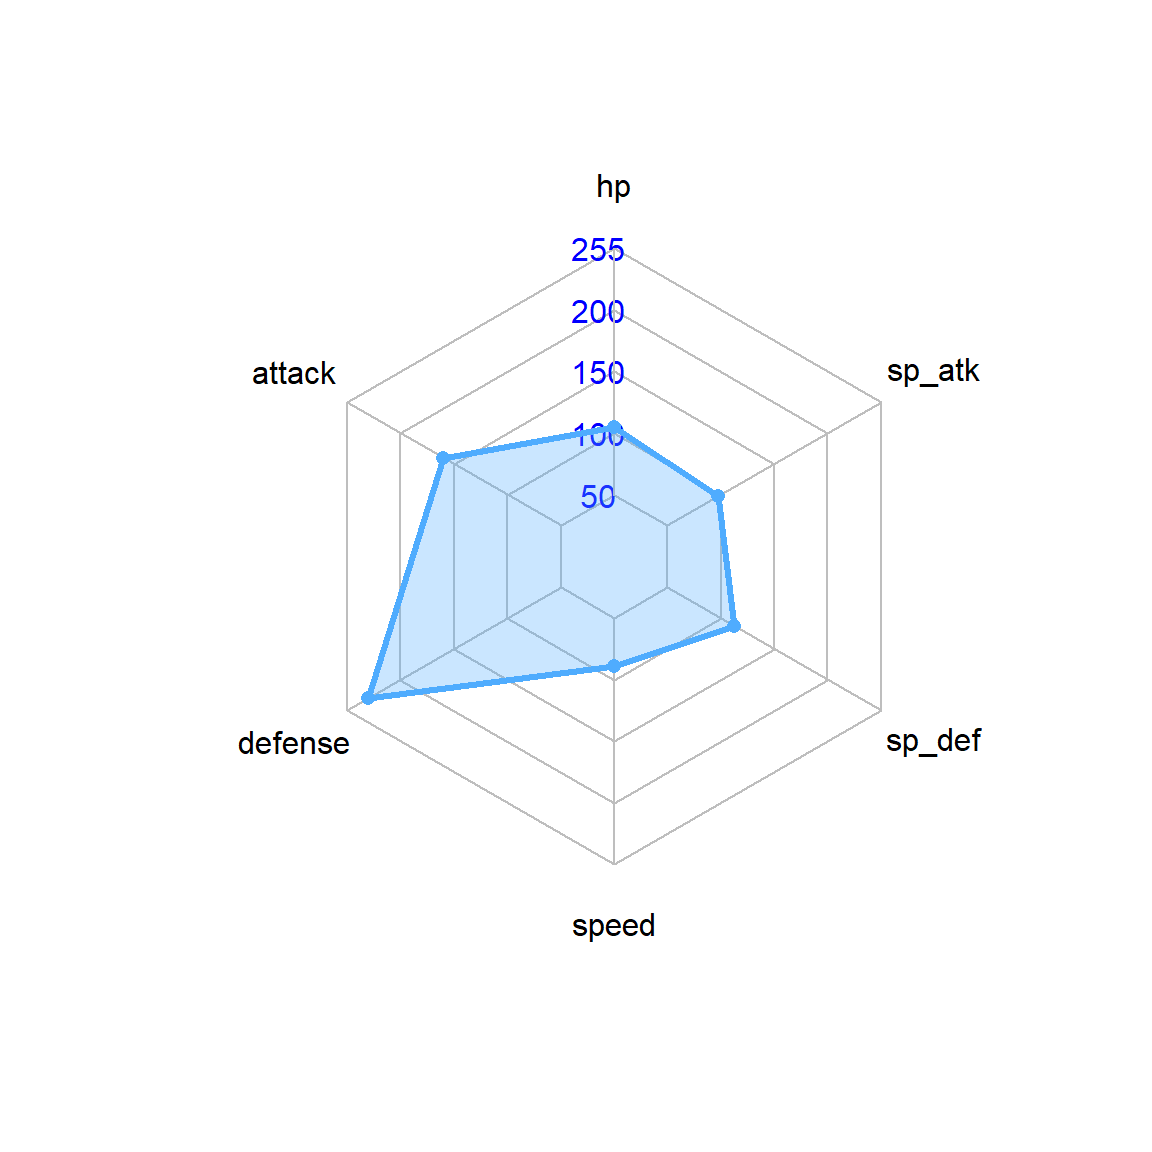
⭐Are they strong?
- Mega Alakazam
- A hyper-fast glass cannon with overwhelming Special Attack. Extremely dangerous but very fragile.
- Mega Metagross
- One of the strongest and most reliable Megas: excellent stats, great movepool, and incredible all-around pressure.
- Mega Aggron
- A near-unbreakable physical wall with minimal weaknesses; low speed but exceptional tank performance.
Regular Pokémon List(Best to worst)
read.csv("data/top_regular.csv") |>
  mutate(defensive_rating = round(defensive_rating, 2),
         offensive_rating = round(offensive_rating, 2)) |>
  DT::datatable(
    options = list(
      pageLength = 10,
      scrollX = TRUE
    )
  )
Effectiveness of the Rating System
Overall, the rating system effectively highlights the strongest offensive and defensive Pokémon across the series. High-ranking entries such as Mega Rayquaza, Mega Mewtwo Y, Ultra Necrozma, and Zacian-Crowned consistently align with established competitive knowledge, confirming that the model captures real power ceilings rather than producing arbitrary results.
On the defensive side, the appearance of Zygarde Complete Forme is not an error but a reflection of its unique mechanics. Although it requires dropping below 50% HP to transform, its Complete Forme possesses one of the highest bulk profiles in the franchise—making its top placement a natural outcome of its inflated defensive stats.
Taken together, the rankings demonstrate that the system successfully identifies both statistically dominant Pokémon and those whose power derives from special forms, transformations, or extreme stat distributions. The model’s outputs are therefore consistent, interpretable, and aligned with known competitive trends.
Discussion
EDA KEY FINDINGS
- Stats Distribution: The distribution of Pokémon’s base stats is not normal, but rather a multi-modal distribution.
- “Stats Monster”: “Has Dragon Type” pokemons owns greatest mean of BST.
- “Birds Everywhere Outside”: Normal/Flying type Pokémon are the most numerous, followed by Bug/Flying type.
- “Pokémon Ecology”: Despite their exaggerated scale, Pokémon size distributions share a similar right-skewed shape with real animals.
PCA Results
- First 3 components capture ~70% of variance
- PC1 represents battle effectiveness, PC2 represents physical size
- Legendary Pokémon clearly separated in principal component space
Clustering Results
- 4 distinct archetypes identified
- Elite tier (high BST, 35% legendary) vs casual tier (low BST, 0% legendary)
- Balanced distribution across defensive, balanced, and offensive clusters
Classification Results
- Random Forest achieves 99.5% AUC (near-perfect classification)
- Legendary Pokémon are 99% separable by base stats alone
- Total BST is the single most important feature
Dual Rating System Benefits
- Separate Offensive & Defensive Evaluation: No longer forced to choose between attacking power and tanking ability
- Type Synergy Recognition: Defensive typing contributes 30% to defensive rating
- Mixed Attacker Support: Algorithm recognizes both specialized and versatile attackers
- Speed Flexibility: Values both fast sweepers and Trick Room users
- Balanced Defense Rewards: Geometric mean prevents glass cannon defenses
Best Type Combinations
Offensive: Ground, Fighting, Fire (high super-effective coverage) Defensive: Steel/Fairy, Steel/Flying, Water/Ground (few weaknesses, many resistances)